Here is a good op-ed in today's Wall Street Journal ("China's Real-Estate Frenzy") that highlights the growing real estate bubble forming in China. After experiencing a modest correction during the summer, pricing and activity appear to be back in an upswing. However, as yesterday's 25bps interest rate hike demonstrated (building on the first 25bps hike in October), Chinese government officials are slowly waking up to the realization that they need to do something before things get really out of control. One interesting point highlighted in the article is that there are no property taxes in China. As such, the carrying costs for holding an empty apartment are negligible. In order to curb speculative activity, I think Chinese officials should implement some sort of property tax, even if modest.
Here are some other good highlights from the article:
Last week I sold an apartment in Beijing for more than 2.5 times what I paid for it five years and three months ago [more than a 20% IRR!]. When I asked the buyer why he was optimistic about real estate, he explained that land was limited in Chinese cities and government policies would keep the market going up.
Housing prices in the U.S. peaked at 6.4 times average annual earnings this decade. In Beijing, the figure is 22 times.
In the past, when China could depend on growing export markets, technocrats in Beijing were able to keep speculative frenzies in check with periodic crackdowns...But this time nobody is listening. Local governments and banks have set up off-balance sheet vehicles to conceal loans and keep the spending boom going. Fitch Ratings estimates that not only did banks exceed the central bank's 7.5 trillion yuan ($1.1 trillion) cap on lending for this year, they made an additional three trillion yuan of these shadow loans.
When a government loses control of monetary policy, inflation follows. A few months ago, only the scariest "China bears" predicted 6% inflation for next year; now the People's Daily is admitting it may reach those levels "in some months."
Tuesday, December 28, 2010
Thursday, December 23, 2010
Germany Not Immune to Europe’s Contagion
Here is a good article from today's FT ("Germany not immune to Europe’s contagion") that highlights the mounting pressures facing Germany. Although on a standalone basis, Germany should be fine, its banks are highly exposed to contagion risks in Europe's periphery. The article posits that if Spain should default, German yields (which are currently under 3%) could rise sharply higher. Further, German CDS spreads have recently hit new highs (excluding the time period surrounding Lehman's bankruptcy) and the ultra-safe swiss franc has been steadily climbing against the euro. Here are some of the highlights from the article:
The very idea that Germany could be caught up by contagion from the eurozone debt crisis seems risible. Its benchmark interest rates, those for 10-year Bunds, trade below the equivalent levels for the US, UK and France.
Yields of just shy of 3 per cent for 10-year money hardly smack of trouble. Inflation is unlikely to cause problems soon, unlike in the UK and potentially in the US thanks to quantitative easing. It also enjoys a sizeable current account surplus, meaning it is not at the mercy of foreigners for financing, unlike many in Europe. In short, its bonds are still seen as the safe haven of at least the eurozone.
Nonetheless, the whispers are starting against Germany. Yields have risen by more than half a percentage point since their lows in October. Unlike the corresponding rise in US yields, which many see as the result of higher growth expectations, few are touting higher output as a reason for Bunds spiking.
Instead, the markets are firmly putting the blame on the prospect of contagion and in particular the fear that Germany could end up coughing up to bail out most of the so-called periphery of the eurozone.
Pimco, one of the world’s largest bond investors, which by chance is owned by Allianz, the German insurer, has for several months privately been warning that German yields could shoot up once the price of the various European rescue schemes are factored in. Germany’s exposure should remain manageable if the crisis stays restricted to Greece and Ireland (and probably poor Portugal, the next in line for a bail-out).
But the 50-100 basis points question for Germany is what happens to Spain. Should it need a bail-out – and its yields continue to hover close to euro-era highs – then Germany is on the hook for tens of billions of euros more and its yields could well shoot up.
Wednesday, December 8, 2010
China's Inflation Is A Monetary Phenomenon
Here is a good chart from todays WSJ (“China's Inflation Is a Monetary Phenomenon”) highlighting the growth in China’s M2 since 2002 and the recent surge in food inflation. As demonstrated in the chart below, M2 growth peaked last November at approximately 30%. Given that inflation generally lags M2 growth by 12-18 months, we are now only starting to see the effects of last year's massive lending binge work their way through China's CPI data.
A big theme for the year ahead will be how aggressive China and other emerging market central banks are in tamping down inflationary pressures that are clearly bubbling up in their economies. Should central banks accelerate their recent tightening measures, we could see global economic growth fall well short of the more bullish forecasts starting to gain sway with investors (though the lagging effect of these actions suggests this will be more of a 2H 2011/1H 2012 problem).

For a similar article on the inflationary pressures building up in Brazil see another article from today's WSJ - "Inflation Dilemma Looms for Brazil's Rousseff."
On the campaign trail, Ms. Rousseff promised to lower Brazil's sky-high interest rates. But in order to tamp down inflation, Brazil's central bank is getting ready to raise rates, not lower them, economists say. Central bank directors are meeting Wednesday to discuss potential rate increases. Many Brazilian economists expect the country to boost its 10.75% interest rate—among the highest in the world—by the end of January at the latest....
Inflation picked up as Brazil's government took on more debt to boost spending after the global financial crisis. The stimulus helped Brazil weather the downturn. But two years later, the stimulus spending has juiced up Brazil's natural growth rate of around 4.5% to a China-like 7%, creating inflation along the way.
"The inflation issue requires a policy response," says Marcelo Carvalho, who follows Brazil at BNP Paribas in São Paulo.
Brazil's Finance Minister Guido Mantega, who is set to remain in his job once Ms. Rousseff takes office, said this week that the federal government will introduce a series of inflation-fighting spending cuts.
A big theme for the year ahead will be how aggressive China and other emerging market central banks are in tamping down inflationary pressures that are clearly bubbling up in their economies. Should central banks accelerate their recent tightening measures, we could see global economic growth fall well short of the more bullish forecasts starting to gain sway with investors (though the lagging effect of these actions suggests this will be more of a 2H 2011/1H 2012 problem).
For a similar article on the inflationary pressures building up in Brazil see another article from today's WSJ - "Inflation Dilemma Looms for Brazil's Rousseff."
On the campaign trail, Ms. Rousseff promised to lower Brazil's sky-high interest rates. But in order to tamp down inflation, Brazil's central bank is getting ready to raise rates, not lower them, economists say. Central bank directors are meeting Wednesday to discuss potential rate increases. Many Brazilian economists expect the country to boost its 10.75% interest rate—among the highest in the world—by the end of January at the latest....
Inflation picked up as Brazil's government took on more debt to boost spending after the global financial crisis. The stimulus helped Brazil weather the downturn. But two years later, the stimulus spending has juiced up Brazil's natural growth rate of around 4.5% to a China-like 7%, creating inflation along the way.
"The inflation issue requires a policy response," says Marcelo Carvalho, who follows Brazil at BNP Paribas in São Paulo.
Brazil's Finance Minister Guido Mantega, who is set to remain in his job once Ms. Rousseff takes office, said this week that the federal government will introduce a series of inflation-fighting spending cuts.
Wednesday, December 1, 2010
Eurozone Bond Spreads Blowing Out
Here is a great chart from yesterday's Financial Times highlighting the growing credit crisis in the euro zone. The bottom left graph clearly demonstrates how credit spreads have blown out over the last few months. As investors turn their attention to the next dominoes to fall, Spanish bond yields have risen to approximately 300bps wide of German yields. Even more concerning is that Italian bond yields have blown out to 210bps wide of German yields (the highest spread since the euro came into effect). While Ireland and Spain both entered the credit crisis with very low government debt to GDP ratios (less than 30% for Ireland and less than 50% for Spain), the FT reports that Italy's sovereign debt to GDP will be about 118% by year end. On the positive front, Italy's banks remain far healthier than those in Ireland and Spain, though the country faces significant refinancing risk in 2011, with Eur300bn of total debt (sovereign plus bank) maturing during the year. Out of this 300bn, approximately 1/3 of it is due in the first three months. While equity markets continue to rally in the US, investors ought not to dismiss the contagion risks spreading throughout Europe.


Tuesday, November 23, 2010
Spanish Banks' Dependence on Wholesale Financing
This chart from a September 30, 2010 Economist article (“Two Cheers, Three Tiers”) sums up the significant risk building up in Spain’s banking system.
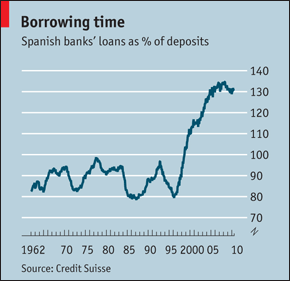 As suggested in the chart, Spanish banks’ loans as a percent of deposits have leapt to approximately 130% over the last decade. This 30% gap has been filled by wholesale financing, which tends to be much less sticky than retail deposits (think Lehman or Bear Stearns, which faced a massive run when their access to the capital markets dried up essentially over night). While the larger and healthier Spanish banks have been able to access wholesale financing (albeit at higher rates), the vast majority of the country’s financial institutions have been shut out of this market. As such, the country is in the midst of a severe deposit war, with the Economist suggesting that “banks are trying to claw share from the beleaguered cajas by offering rates as high as 4%. Higher funding costs are squeezing net interest margins, which fell by 6.4% in the first half of the year for the banks and by nearly a quarter for cajas.”
While drawing too many parallels to Ireland may be a bit premature, its important to note that Ireland’s bailout was precipitated by the rapid loss of retail deposits from the nation‘s largest banks. As an example, Allied Irish lost €13 billion ($21 billion) of deposits since the beginning of the year. Investors fearing contagion to Spain should monitor carefully the deposit levels in the country’s banking system.
As if the deposit war isn’t concerning enough, the Economist concludes the article by commenting “that banks still have €323 billion of exposure to property developers, which for some is close to four times their core capital.”
 As suggested in the chart, Spanish banks’ loans as a percent of deposits have leapt to approximately 130% over the last decade. This 30% gap has been filled by wholesale financing, which tends to be much less sticky than retail deposits (think Lehman or Bear Stearns, which faced a massive run when their access to the capital markets dried up essentially over night). While the larger and healthier Spanish banks have been able to access wholesale financing (albeit at higher rates), the vast majority of the country’s financial institutions have been shut out of this market. As such, the country is in the midst of a severe deposit war, with the Economist suggesting that “banks are trying to claw share from the beleaguered cajas by offering rates as high as 4%. Higher funding costs are squeezing net interest margins, which fell by 6.4% in the first half of the year for the banks and by nearly a quarter for cajas.”
 While drawing too many parallels to Ireland may be a bit premature, its important to note that Ireland’s bailout was precipitated by the rapid loss of retail deposits from the nation‘s largest banks. As an example, Allied Irish lost €13 billion ($21 billion) of deposits since the beginning of the year. Investors fearing contagion to Spain should monitor carefully the deposit levels in the country’s banking system.
As if the deposit war isn’t concerning enough, the Economist concludes the article by commenting “that banks still have €323 billion of exposure to property developers, which for some is close to four times their core capital.”
Saturday, November 20, 2010
Japan's Demographic Timebomb
Here is a great picture from a recent Economist article (“Into the Unknown”) showing the rapid shift in Japan’s population from 1950 to 2055. From 1955 to 2005, the steadily increasing population of working age people (reflected in the pyramid shape of the left most schematic) and rising productivity of its workforce propelled Japan to become the world’s second largest economy. However, over the next forty years, the working age population is forecasted to shrink so quickly that by 2050 it will be smaller than it was in 1950 (dropping from a high point of 87mm in 1995 to less than 50 million by 2050; see second chart). Similarly, over this timeframe, Japan’s population, currently 127 million people, is expected to fall by 38 million or nearly 30%! By 2050, four out of ten Japanese will be over 65.
As the population ages, the nation’s pension system is becoming increasingly strained. When public pensions were introduced in the 1960s, there were 11 workers for every pensioner. Now there are a mere 2.6, compared with an OECD average of four.
Finally, Japan’s rapidly aging population has resulted in a substantial reduction in the nation’s savings rate. Once above 20% of disposable income, the ratio has dropped to about 2%, and the Economist posits that it could go negative over the next few years. Given that 95% of the government’s debts are financed by domestic savings (primarily banks, pension schemes, and insurance companies), Japan could be forced to seek external financing to sustain its huge public sector debt. Rates would undoubtedly rise under this scenario given that Japan currently borrows at a paltry 10-year rate of 1% from its risk-averse populace.
Given all these facts, its not terribly difficult to sympathize with the bearish thesis surrounding Japanese government bonds.

Thursday, November 11, 2010
Sovereign CDS Spreads Widening in Europe
European sovereign 5-year CDS spreads are blowing out this morning, with Spain at 285bps (+58.5bps), Portugal at 495bps (+78bps), and Ireland 605bps (+65bps). As of now, concerns seem contained to the Euro zone, but I think it is only a matter of time before we start seeing the residual effects spill over into the United States. US treasuries in the belly of the curve (2-5 years) remain well bid, as investors try and front run the Fed’s $600 billion quantitative easing program, but the yields on the long-end of the curve (particularly 30-year treasuries, where the Fed will only do marginal buying) have blown out over the last few days. Yesterday’s weak $16 billion auction of 30-year treasuries could serve as the canary in the coal mine for investors who have been piling into fixed income over the last 18 months.
Spain

Portugal

Ireland

Here are a few recent articles from the WSJ that address mounting concerns in the Euro zone.
Spain’s Bank Mergers Suddenly Drying Up
QE2 Off its Course: Yields Are Going Up
Ireland’s Next Blow Could be Home Loans
Spain

Portugal

Ireland

Here are a few recent articles from the WSJ that address mounting concerns in the Euro zone.
Spain’s Bank Mergers Suddenly Drying Up
QE2 Off its Course: Yields Are Going Up
Ireland’s Next Blow Could be Home Loans
Tuesday, November 9, 2010
Systemic Risks Posed by ETFs
Here is a great report published by Harold Bradley and Robert Litan of the Kauffman Foundation warning about the potential dangers caused by the explosion of ETFs. The authors conclude that the growth in ETFs and ETF derivatives poses more of a systemic danger to the financial system than the advent of high frequency trading. At 84 pages, the report is highly detailed and fairly technical, but definitely worth a read for those interested in learning more about the subject. While I am by no means an expert into the inner workings of the financial markets (at least as it pertains to high speed algorithmic trading), all I could think about as I was reading this report was that we could be facing another October 1987 type-meltdown should regulators continue to ignore the rapid growth in the ETF market.
ETFs have proliferated around the globe at an astounding pace, from roughly ninety at the beginning of this decade to about 450 at the end of 2005 and more than 2,300 today, with another 1,000 or so in the regulatory pipeline (see chart 4).

But there can be too much of a good thing if taken to extremes,and this is now happening with ETFs. From an asset base of about $75 billion a decade ago, ETF assets now approach $1.2 trillion, with trading reaching an astounding $18.2 trillion last year. ETFs have been morphing in new and unexpected ways. Simply put, we will argue here that ETFs and the derivatives built around them have become the proverbial tail that wags the market.
As more ETFs are created, the risk grows that in the event of a future market meltdown triggered by any number of possible causes the rush to unwind the ETFs will aggravate any sell-off. Indeed, some creators of ETFs may not be able to honor their obligations. If those institutions or holders of ETFs are deemed sufficiently important or interdependent with other financial actors, the U.S. government could be forced again to make the agonizing decision whether to come to the rescue, as it did with AIG and a number of other large enterprises during the financial crisis of 2008.
Monday, October 4, 2010
Reevaluating Gold
Ever since I began this blog in late 2008, I have been an advocate for investing in gold. While the massive support provided by the Fed in the wake of the collapse of Lehman Brothers helped forestall a complete financial meltdown, I thought the unprecedented monetary stimulus injected into the system would ultimately prove inflationary (admittedly this doesn’t seem to have played out yet, though the recent rise in gold and other industrial commodities suggests we may not be too far off).
With a near 60% return over the last two years, I think it is prudent to reevaluate my thesis and consider the merits of maintaining a position. The rampant media attention given to gold’s ascent above $1300/ounce suggests that my thesis is hardly unique and that the yellow metal could be migrating into bubble territory.
As an unrepentant contrarian, I always grow nervous when my thesis is shared by the broader investing community. Asset prices tend to climb a wall of worry and I am afraid that we are reaching a point where even the most hardened skeptics have thrown in the towel (See the A1 Section of the September 28th WSJ "Gold Vaults to New High."
Despite a growing unease, little has changed since my original purchase, and I intend to hold my position for the time being (hopefully, you can sense the waning lack of conviction in that statement!). Underlying my thinking are the following points:
1. Central banks across the globe continue to aggressively counteract strength in their currencies. The Bank of Japan is selling yen in order to hold down its currency. The US Federal Reserve gave a clear indication in its last statement that it stands ready to support the economy should evidence of a double dip begin to take hold (i.e. “QE2” – whatever form that will come in). Never mind that a second dose of stimulus implicitly proves the ineffectiveness of the first round (when the Fed purchased $1.75 trillion of treasuries and mortgage backed securities); Bernanke and crew remain willing to do whatever it takes to avoid a deflationary debt spiral and I believe they are willing to err on the side of too much stimulus rather than too little.
Just as investors doubted Paul Volker’s ability to arrest the pernicious inflation of the late 70s (a battle which took over 2 years to win), the common refrain from today’s “experts” is that Bernanke is fighting a loosing battle. Talk of the US mirroring the path of Japan is almost as prominent as talk of gold being in a bubble.
While I believe the Fed’s campaign may ultimately undermine the US dollar’s status as a reserve currency (hence my investment in gold!), I have read the transcript of enough Bernanke speeches to know that he remains committed to the task at hand. Until the Fed takes its foot off the accelerator, it’s difficult to turn bearish on gold. Conversely, once the Fed credibly lays out an exit plan, I will be the first to exit my position, no matter how much money I end up leaving on the table.
2. Despite less media attention given to the situation in Europe, the PIIGS remain in deep financial distress. The situation in Ireland can only be described as a crisis, with the Irish government estimating that up to €50 billion may be needed to stabilize its banking system. Even more staggering, the country is anticipated to run a deficit of more than 30% of GDP this year!
On the other side of Europe, Greek CDS spreads suggest that default is highly likely despite China’s commitment to buy up to $5 billion of the country’s government debt. Even credit default spreads in Spain and Portugal have edged up over the last few weeks, with investors skeptical that announced austerity measures will be enough to get their fiscal houses in order. While this would have been front page news in May, concerns over the PIIGS have receded to the background, as US investors focus squarely on the improving macro data. Despite the best September for the stock market since 1939, little has changed in Europe and investors ought not to forget the fears that existed earlier this year.
3. The mounting problems in the $2.8 trillion municipal bond market are slowly starting to play out. While a discussion of this issue will have to be saved for another post, suffice to say that the recent default by the city of Harrisburg (which was forced to be bailed out by the state of Pennsylvania) will be the first of many defaults by a municipal borrower. Just as the bankruptcy of New Century in April 2007 served as the canary in the coal mine for the subprime debacle, so too will Harrisburg’s default for the municipal bond market. I wouldn’t be surprised if we begin talking about a TARP for state & local governments as we enter the next stage of the credit crisis.
4. As mentioned before, while the market experienced a strong September, this move was hardly confirmed by financial stocks (many of which hit 52 week lows during the month). This lack of confirmation from the leading financials is eerily reminiscent of 3Q 2007, when the stock market seemingly ignored the mounting problems in the credit markets to rally to all times highs in October 2007.
A slowdown in trading activity, flattening yield curve, declining loan growth, and potential for another wave of home price declines/foreclosures, suggests a very challenging environment for the banks over the next few quarters. While the Obama administration is currently taking a victory lap with the apparent success of the TARP program (which is estimated to ultimately cost US taxpayers less than $50 billion), the stalled rally in financials suggests that we shouldn’t quite yet break out the “Mission Accomplished” banners. This is particularly the case as the heightened regulations emanating from the new financial bill begin to take effect.
5. Surplus countries, primarily China and India remain underinvested in gold (with less than 5% of their assets in the yellow metal). While China talks publicly about their commitment to both the euro and the dollar, I have to believe that behind closed doors they are growing increasingly nervous about their currency holdings. Should China and India step up their purchases of gold over the next year, the move from $800 to $1,300 may only be the beginning.
In summary, while gold is on the throes of becoming a crowded trade, I don’t think we have reached the euphoric stage that often characterizes market tops. Similarly, I contend that the fundamentals underlying my original thesis (as noted above) remain firmly intact and that there is still decent upside from today’s levels. As long as central banks remain stubbornly committed to seemingly unending monetary stimulus and competitive currency devaluations ("Beggar the World"), gold should continue to climb to new highs.
Monday, September 27, 2010
2010 - 2018 High Yield Maturity Schedule
This is a great chart from Knight Libertas highlighting the maturity schedule for high yield and leveraged loans over the next 8 years. While 2010 and 2011 looks manageable ($110bn due through 2011), maturities start to ramp up thereafter with $147bn due in 2012, $245bn due in 2013, and a staggering $405bn due in 2014. As demonstrated in the chart, the lion’s share of the 2014 maturities are comprised of leveraged loans used to finance the wave of borrowing undertaken by PE firms in the 2006 and 2007 LBO wave. While the massive inflow of capital into credit could continue for sometime, I suspect we will hear more and more about this “maturity wall” as late 2012/early 2013 approaches.


Monday, September 20, 2010
Momentum Stocks Getting Bid Up
While most equity market indices are up only a few percent year-to-date, momentum stocks with strong growth outlooks (particularly in the tech sector) have outperformed significantly. As an unrepentant value investor, this has been a source of deep frustration to me since most of these stocks hardly seemed like bargains going into 2010.
As demonstrated in the table below, I have selected a basket of 10 stocks that loosely fit the parameters of a “momentum growth” stock. The ten stocks include F5 Networks, Netflix, Akamai Technologies, Finisar, Salesforce.com, Citrix Systems, Riverbed Technologies, NetApp, VMWare, and Acme Packet.
Nearly all are up over 50% year-to-date, recently hit fresh 52-week highs, and have business models that fit squarely into the portfolios of managers seeking growth. Unlike the bubble years of 1999, when nearly any tech stock with a “.com” at the end of its name was bid up to ridiculous levels, these 10 stocks have strong competitive positions within very attractive secular growth markets. And most importantly - All are profitable and generating decent free cash flow.
My only contention (and of course the most critical determinant to a value investor) is the massive multiple these companies trade at relative to current and 1-year forward earnings estimates. As an experiment, I am going to pretend that I purchased $10,000 of stock in each one of these ten companies as of the close of 9/20/10. If a similar experiment had been performed at the end of 2009, one would be up 111% year-to-date.
It will be interesting to see how this basket of stocks performs 6 months out when I will evaluate the results on my blog. I honestly have little conviction on how things will turn out, but the value investor in me thinks that most will be substantially lower.
Now I always like to say that I passed on Google when it came public at $85 (and I evaluated it pretty extensively pre-IPO) so my opinion on growth stocks should be taken with a healthy dose of skepticism. However, the disconnect between growth and value seems more extreme than at any point since the waning days of the tech bubble. Perhaps this experiment will lend some credence to this view (or once again make me eat my words!)
I look forward to reporting back in March of next year.

Wednesday, September 1, 2010
Brazil's Farming Revolution
The Economist ran with a great feature story last weekend on the tremendous growth of the Brazilian agriculture economy (“The Miracle of the Cerrado”). While it is a fairly in-depth article, one of the more fascinating takeaways is highlighted in the chart below. With only 50 million of its 400 million hectares of arable land currently being utilized, Brazil has significant spare farming capacity to help feed the world’s growing population. In fact, Brazil has as much spare farmland as the next two countries together (Russia and America). Given that the world’s population is anticipated to rise from 7 billion to 9 billion by 2050 (in addition to a doubling of the urban population over that timeframe), Brazil’s agricultural economy will play a vital role in feeding this growing population, which will require a 50% increase in grain output and a 100% increase in meat production.
In addition to being blessed with significant spare farmland, Brazil is awash in fresh water. According to the UN’s World Water Assessment Report of 2009 highlighted in the article, Brazil has more than 8,000 billion cubic kilometers of renewable water each year, more than any other country. Brazil alone (population: 190m) has as much renewable water as the whole of Asia (population: 4 billion).
I would encourage everyone to follow the link to the article (see above) to get a more comprehensive overview of the topic since my amateurish summary leaves a lot to be desired.

Friday, August 27, 2010
California Job Losses & Retirement Costs
Here is a great chart from today's Wall Street Journal showing the huge disparity between California job losses in the private sector vs. public sector. Since the beginning of 2008, California's private sector has shed nearly 1.2 million jobs, while employment in the public sector has remained essentially flat.
The op-ed piece ("Public Pensions and Our Fiscal Future") also suggests that the California's state government will spend over $6 billion this year on retirement benefits (more than on education), with this figure expected to grow by 15% next year! If these stats aren't dire enough, the annual cost of servicing California's retirement obligations is projected to grow to $30 billion within a decade (more than 5x today's level).
I am not sure what to say other thank goodness I don't live in California!

Wednesday, August 25, 2010
New Home Sales Hit New Cycle Low
New home sales declined by a sharp 12.4% in July to an annualized pace of 276,000 units. The July figure breached the low of 281,000 set in May, which represented the first month after the expiration of the tax credit (when we saw a 32% swoon in new home sales). Since in my June 23rd post, I predicted that May would represent the cycle low, a bit of humble pie is in order. However, I continue to believe that we are in the midst of a healthy bottoming process and that while the month to month trends may contain some volatility, the housing market should be in materially better shape 12-18 months from now. Further, while not receiving much attention in the press, the number of standing units continued to hit a cycle low in July, with only 209,000 units for sale (down 64% from the peak in June 2006).
While the housing ETF (XHB being one of the better proxies for the industry) is down around 8% since my June call, most of the builders are up today, despite the abysmal new home sales number. The industry has proven quite resilient despite the drumbeat of bad news and relentless calls for a double dip in housing. As demonstrated by the early 1990s housing downturn, most of the stocks bottomed 6-9 months before the turn became clearly evident in the reported data. Given the magnitude and duration of the current downturn, I would expect a similar pattern to play out in the current cycle. Investors who share my view that housing will be on much firmer footing in mid-late 2011, will be well rewarded by building positions in today’s environment, particularly when considering that the litany of bad news has driven most builder stocks to trade below book value and off 70-80% from their 2005/2006 peaks.
My bullish view on builder stocks is predicated on the following key themes (and of course I would welcome any points that undermine my view):
- Builders have spent the last several years building substantial cash hoards and deleveraging their balance sheets. Even the most speculative homebuilders (HOV, BZH, SPF) have addressed their debt maturities through 2013, leaving them significant runway to weather a protracted downturn.
- Unlike private builders who finance their operations through construction financing from regional lenders, the public builders finance their business from the unsecured bond market (which has been white hot as of late). Since regional banks have substantially reduced the financing they make available to land development and construction financing, the publics should be in a materially better position to take share exiting the downturn.
- The public builders have substantially reduced their fixed costs and several have turned the corner on profitability or remain within spitting distance of doing so (DR Horton being the clear leader). Achieving profitability with housing starts under 600,000 leaves them well-positioned to earn meaningful returns when the market returns to natural demand (something closer to 1.2-1.5mm housing starts). While it could take a few years to get there, the longer that we build at 1/3 of this level, the more significant the reversal will be when animal spirits kick in.
- In my own personal opinion, the US government is unlikely to cede control over the critical role it plays in supporting the housing market. Repeated comments made by Geithner and other top administration officials lend credence to this view, particularly as the fate of Fannie and Freddie gains more public attention. While I am not necessarily supportive of the government’s strong hand in guiding the housing market (and readers of this blog know full well of my concerns over the Federal Housing Administration), my own personal views are irrelevant in determining how I invest. In the eyes of government, meaningfully altering the current system of mortgage finance seems too dangerous given the precarious state of our economy and mounting concerns over deflation. Obviously, if any change occurs that substantially alters the role of the GSEs in the housing market, than I would most certainly have to reevaluate my favorable long-term view on housing. As John Maynard Keynes famously said, “When the facts change, I change my mind. What do you do, sir?” Any investor worth his salt has to reassess his or her investment thesis when the facts change and I reserve the right to do so.
- Valuations are just too compelling to ignore. Despite being the most liquid they have ever been, the public builders trade around book value, even when considering that their balance sheets have contracted by over 2/3 since the peak of the cycle. Whereas book value was a very dubious measure to evaluate the industry in 2005/2006/2007 (since the balance sheet reflected land bought at the top of the cycle), builders have collectively taken billions of dollars of impairments to more appropriately reflect current market values of their land inventory. Even with order trends remaining abysmal, most builders have stopped taking large impairment charges, reflecting greater confidence in the quality of their asset base. Similar to low book values, most homebuilders are trading at 3-6x normalized earnings. As an example, DR Horton generated an average EPS of $3.90/share from 2004-2006. At a current price of $10/share, this equates to a PE multiple of a mere 2.7x. Even assuming that normalized earnings for DHI will be half that level, one can buy one of the best builders at 5-6x normalized earnings. The mounting concerns in the housing market, coupled with the heightened volatility of the stock market, will undoubtedly result in sharp swings in DHI’s stock (as evidenced by its November 2008 low of $4.34/share). However, there is a little dispute that DHI will remain a leader in the housing market and will disproportionately benefit when the industry inevitably bounces back.
In summary, I believe that one should start buying when there is blood in the street. While I concede that this call may be early (and perhaps painfully so if we have another sharp downturn in the stock market), I am comfortable saying that valuations have gotten low enough where investors are being well compensated for having to endure whatever volatility may occur over the coming months and quarters. The opportunity to make 2-3x one’s money with minimal risk of permanent impairment rarely presents itself to investors. I firmly believe that this dynamic exists with the higher quality builders.
If one has a greater disposition for risk, then perhaps going down the quality spectrum could be appealing (BZH and HOV fit in that category). The ability for these companies to weather a downturn beyond 2-3 years is far from certain and so one should invest in this subset of the industry more carefully. However, I strongly believe that all the public builders that have managed to survive up to this point will avoid bankruptcy, and so the opportunity to make even more than 3x one’s money could be justified for those with a high tolerance for risk. Happy investing!
Tuesday, August 24, 2010
Kyle Bass Interview on CNBC
Below is a great interview with Kyle Bass of Hayman Capital (one of the best macro investors in the game). In addition to talking about the massive structural problems in the European banking system, Bass gives a great overview of his short thesis regarding Japanese government bonds. With a debt to GDP ratio exceeding 200%, government expenses more than two times receipts (40 trillion of revenues vs. 97 trillion of expenses!), and a domestic savings rate approaching zero percent (as retirees begin to draw down on their savings), Heyman believes Japan is fast approaching what he terms a "Keynesian endpoint."
If I am lucky enough to ever run my own hedge fund, betting against Japanese governemnt bonds would unquestionably be one of the first trades I put on. With 10-year JGBs under 1%, this represents one of the most assymetric bets since derivatives on the ABX allowed investors to bet against the US subprime market.
If I am lucky enough to ever run my own hedge fund, betting against Japanese governemnt bonds would unquestionably be one of the first trades I put on. With 10-year JGBs under 1%, this represents one of the most assymetric bets since derivatives on the ABX allowed investors to bet against the US subprime market.
Friday, August 13, 2010
Manhattan Condos Embracing FHA
Here is a pretty crazy article from Bloomberg ("Manhattan Luxury Condos Embrace FHA in 'Game Changer') on how developers in Manhattan are trying to get the FHA to back mortgages in their properties. Amazing how an institution created during the height of the Great Depression to make homeownership affordable for low income families is now supporting the NYC luxury real estate market.
Nationwide, the FHA insured 21 percent of all mortgages made in the second quarter, or $71.4 billion worth of loans, according to Geremy Bass, publisher of the Inside FHA Lending newsletter. That’s close to the $79.5 billion total value of all FHA-backed loans in 2007.
The agency’s backing of luxury condos “doesn’t look good,” said Andrew Caplin, a professor of economics at New York University who co-wrote a paper titled “Reassessing FHA Risk.”
“Manhattan wealthy people -- is this really who the FHA was set up to support?” he said in an interview.
Caplin testified before Congress in March, arguing that FHA may need a taxpayer bailout because the agency relies on overly optimistic assumptions on unemployment, home prices and loan performance to predict losses.
Nine percent of all FHA-insured loans were 90 days or more past due or in the process of foreclosure in the first quarter, compared with 7.4 percent a year earlier, data from the Washington-based Mortgage Bankers Association show.
Friday, July 30, 2010
Bonds Soar to Rare Heights
Yields on investment grade bonds have shrunk to less than 4%, the lowest level in more than 6 years, and just 1.7% points above treasuries (see front page article on the WSJ – “Bonds Soar to Rare Heights”). In a sign of the times, McDonalds raised $450 million in 10-year debt at 3.5% this week, a record low yield for a US corporate borrower for at least 15 years. Commonweath Edison Co., the electric utility owned by Exelon, sold 4% mortgage bonds at the company’s lowest 10-year coupon since the 1950s.
While concerns of a double dip recession and the reemergence of deflationary fears continue to gain more traction, I believe the stampede into credit will have profound consequences if sustained for much longer. Committing new capital to fixed income at today’s paltry yields could only be justified if one believes we are heading for a Japanese style debt deflation. While I am staying on the sidelines (though maintaining a position in some floating rate debt funds), clearly I am in the minority given the billions of dollars of new money flowing into fixed income funds each week.
Anybody skeptical that the Fed would tolerate a bout of severe deflation should read comments out this morning from James Bullard, the President of the Federal Reserve Bank of St. Louis. Here is a snippet from a research paper released today.
“The U.S. is closer to a Japanese-style outcome today than at any time in recent history,” Bullard said, warning in a research paper released today about the possibility of deflation. “A better policy response to a negative shock is to expand the quantitative easing program through the purchase of Treasury securities.”

Friday, July 9, 2010
Another Solid Month for California Housing Market
While housing activity on a national basis has declined sharply over the last few months due to the expiration of the $8,000 new homebuyer tax credit, California data for the month of May continues to reflect steady improvement. Given that California led the rest of the country into the housing downturn, it is encouraging to see the region showing concrete evidence of a bounce off the bottom. Notwithstanding the encouraging data from May, June and July will likely show a falloff in activity (similar to the rest of the country), but it is important to put in context the level of healing that has emerged over the last year (see accompanying charts for evidence). Barring a significant decline in the economy, it seems highly unlikely for California to retest the lows in activity and pricing that reflected the state’s housing market in the dark days of early 2009.
As indicated in the chart below, May home sales in Southern California were up 7.2% year-over-year with Los Angeles, Orange County, and San Diego up 12.3%, 22.1%, and 19.6%, respectively. Unit prices were also strong, up 22.5% year-over-year and 7% vs. April 2010. Since bottoming in April 2007 at $247,000, median home prices in SoCal have risen by 23.5% to $305,000. Though prices have risen smartly off the bottom, they are still down 40% from the peak, with pricing in the inland empire down well over 50% off the top.
.bmp)
.bmp)
Similar to Southern California, the Bay Area continues to show significant evidence of a rebound. May home sales were up 11% year over year, with the higher end regions (San Fran, Marin County, Santa Clara) up well over 20%. The trends in pricing were even more encouraging, with prices up 20.1% year-over-year and up 10.8% vs. April. Since bottoming in March 2009 at $290,000, home prices have risen by a sharp 41.4% to $410,000 in May 2010. While mix has undoubtedly padded that figure, all regions tracked by Dataquick have seen pricing up by double digits off the bottom.
.bmp)
.bmp)
Tuesday, July 6, 2010
Illinois Stops Paying its Bills
Here is a must read article from the NY Times ("Illinois Stops Paying Its Bills, but Can’t Stop Digging Hole") that highlights the fiscal mess brewing in Illinois. The mounting deficits facing most of our states (with California, NY, and Illinois being the most egregious) presents the gravest threat to the long-term health of our country. Anyone holding muni bonds in their portfolio should think long and hard about the wisdom of this decision after reading the linked article.
Here are some of the key paragraphs from the article:
For the last few years, California stood more or less unchallenged as a symbol of the fiscal collapse of states during the recession. Now Illinois has shouldered to the fore, as its dysfunctional political class refuses to pay the state’s bills and refuses to take the painful steps — cuts and tax increases — to close a deficit of at least $12 billion, equal to nearly half the state’s budget.
Then there is the spectacularly mismanaged pension system, which is at least 50 percent underfunded and, analysts warn, could push Illinois into insolvency if the economy fails to pick up.
States cannot go bankrupt, technically, but signs of fiscal crackup are easy to see. Legislators left the capital this month without deciding how to pay 26 percent of the state budget. The governor proposes to borrow $3.5 billion to cover a year’s worth of pension payments, a step that would cost about $1 billion in interest. And every major rating agency has downgraded the state; Illinois now pays millions of dollars more to insure its debt than any other state in the nation.
The state pension system is a money sinkhole and the most immediate threat. The governor and legislature have shortchanged the pensions since the mid-1990s, taking payment “holidays” with alarming regularity.
The state’s last elected governor, Rod R. Blagojevich, is on trial for racketeering and extortion. But in 2003, he persuaded the legislature to let him float $10 billion in 30-year bonds and use the proceeds for two years of pension payments.
That gamble backfired and wound up costing the state many billions of dollars. Illinois reports that it has $62.4 billion in unfunded pension liabilities, although many experts place that liability tens of billions of dollars higher.
Wednesday, June 23, 2010
Time to Start Nibbling on Housing Sensitive Stocks
With new home sales down 32.7% in May, the housing bears are once again gaining an audience with the media. While there is little doubt that housing remains in the doldrums, I am getting increasingly bullish at today’s levels and believe that investors with a longer-term time frame (at least 1-2 years) should think about dipping their toes into housing related stocks. The 30%+ declines in many homebuilders over the last few months provides an attractive entry point for those willing to look past that bevy of seemingly bad news over the last few weeks.
Firstly, the huge swoon in May largely reflects the falloff in activity post the expiration of the $8,000 tax credit on April 30th. Homebuilders aggressively built inventory in the first four months of 2010 in anticipation of pulling would be buyers into the market. As such, we saw new home sales increase by 12.1% in March and 14.7% in April, so naturally we were going to see a steep decline in May. Admittedly, 33% was worse than most pundits expected, but I firmly believe that May’s print will represent the trough in this brutal 5-year housing downturn. To put the 300,000 new home sale in context; this is 8.8% lower than the previous lowpoint (329,000 annualized homes sales in January 2009 – two months after the first tax credit was slated to expire) and a staggering 78.4% below the peak number set in July 2005.

Secondly, the standing inventory of new home sales continues to hit cycle lows (see chart below). In my opinion, this represents a more critical data point to gauge the health of the housing market, since the actual sales number has been significantly distorted by the expiration of the tax credit. May inventories were down 26.7% year over year, 62.7% from the cycle peak hit in June 2006 (nearly one year after the peak in new home sales), and lower than any level since data was first recorded in 1970. So while it is difficult to gauge when sales will pick up with any vigor, the low level of standing inventory suggests the industry is in a substantially healthier position and could realize some unexpected pricing power when things inevitably begin to pick up. A good article in today’s Wall Street Journal ("Beaten Down Markets Finds New Fans") highlights the rapidly declining inventory of finished home lots in several of the nation’s most overheated housing markets. Rising land prices inevitably serves as a precursor to higher home prices.

Affordability also should provide another floor on both pricing and volumes. With a peak to trough decline of 33% in home prices (see chart below) and mortgage rates under 5%, today has never been a better time to purchase a home for those waiting patiently on the sidelines. Further, the government remains extremely supportive of the housing market through its 1) commitment to keep long-term interest rates down (however, distortive these actions may prove to be); and 2) its backstop of the mortgage program through the FHA and GSEs. My firm believe is that the government will continue to flood the market with liquidity should evidence of a double dip begin to gain more traction. Multiple speeches given by Bernake suggest that he will do whatever it takes to stabilize the economy no matter how damaging said actions are on the federal balance sheet.
 In conclusion, while concerns in housing have begun to resurface, I think the structural rebalancing that began in June 2005 is nearing its final stages. As with any market, the tendency to overcorrect is highly probable and investors should expect significant volatility over the coming quarters. However, my bias is always to invest when valuations have troughed and fundamentals have meaningfully improved. The upside to today's dismal new home sale number is that the data could hardly get any worse; given how difficult the housing space space has been for the last 5 years that in and of itself is cause for celeberation. For those with a longer-term time frame, investments made at the bottom of the cycle should prove prescient in years to come.
Firstly, the huge swoon in May largely reflects the falloff in activity post the expiration of the $8,000 tax credit on April 30th. Homebuilders aggressively built inventory in the first four months of 2010 in anticipation of pulling would be buyers into the market. As such, we saw new home sales increase by 12.1% in March and 14.7% in April, so naturally we were going to see a steep decline in May. Admittedly, 33% was worse than most pundits expected, but I firmly believe that May’s print will represent the trough in this brutal 5-year housing downturn. To put the 300,000 new home sale in context; this is 8.8% lower than the previous lowpoint (329,000 annualized homes sales in January 2009 – two months after the first tax credit was slated to expire) and a staggering 78.4% below the peak number set in July 2005.

Secondly, the standing inventory of new home sales continues to hit cycle lows (see chart below). In my opinion, this represents a more critical data point to gauge the health of the housing market, since the actual sales number has been significantly distorted by the expiration of the tax credit. May inventories were down 26.7% year over year, 62.7% from the cycle peak hit in June 2006 (nearly one year after the peak in new home sales), and lower than any level since data was first recorded in 1970. So while it is difficult to gauge when sales will pick up with any vigor, the low level of standing inventory suggests the industry is in a substantially healthier position and could realize some unexpected pricing power when things inevitably begin to pick up. A good article in today’s Wall Street Journal ("Beaten Down Markets Finds New Fans") highlights the rapidly declining inventory of finished home lots in several of the nation’s most overheated housing markets. Rising land prices inevitably serves as a precursor to higher home prices.

Affordability also should provide another floor on both pricing and volumes. With a peak to trough decline of 33% in home prices (see chart below) and mortgage rates under 5%, today has never been a better time to purchase a home for those waiting patiently on the sidelines. Further, the government remains extremely supportive of the housing market through its 1) commitment to keep long-term interest rates down (however, distortive these actions may prove to be); and 2) its backstop of the mortgage program through the FHA and GSEs. My firm believe is that the government will continue to flood the market with liquidity should evidence of a double dip begin to gain more traction. Multiple speeches given by Bernake suggest that he will do whatever it takes to stabilize the economy no matter how damaging said actions are on the federal balance sheet.

Friday, June 18, 2010
China's Share of Global Demand by Commodity
Here is a great chart I pulled from a recent BHP Billiton presentation that shows China’s share of global demand by commodity. Amazingly, China accounts for 63% of metallurgical coal demand (key ingredient in steel production), 56% of iron ore consumption (again, key raw material in steel production), 39% of aluminum demand, 36% of copper consumption, and 35% of global nickel consumption.

Wednesday, June 16, 2010
Long Beach Container Shipments Showing Healthy Growth
Data on container shipments into the Long Beach Port in California provides an excellent snapshot into the overall economy, particularly as it relates to trade with Asia. As indicated in the chart below, inboard container shipments have experienced significant year-over year growth, with May 2010 shipments growing nearly 27%. Since bottoming in February 2009 (one month before the equity markets bottomed), shipments have grown by a staggering 77%, though remain well below the peak levels of 2007, as evidenced by May 2010 shipments which were still 16.4% lower than May 2007 shipments.
However, for those bullish on the US economic recovery, data from Long Beach certainly helps support that view.

However, for those bullish on the US economic recovery, data from Long Beach certainly helps support that view.

Spain's Monthly Funding Requirements - Watch July!
As demonstrated in the chart below, Spain faces a substantial funding gap in July, with 25 billion euros maturing during the month.

The country plans to access long-term capital on Thursday with the sale of 4% bonds due 2020 and 4.7% bonds due July 2041. Not coincidently, several press reports have come out suggesting that Spain is in discussions with the ECB and IMF regarding a bailout. Though Spain has vehemently denied these reports, a disappointing auction on Thursday could expedite said discussions. A seize up of interbank lending in Spain has already forced Spanish banks to borrow record amounts directly from the ECB. According to the FT, Spanish banks borrowed €85.6 billion from the ECB last month, more than double the amount lent to them prior to the collapse of Lehman and up from €74.6 billion in April ("Spanish banks break ECB loan record"). In my opinion, given Spain’s devastated economy and weakened banking system, it is only a matter of time before the country directly taps emergency loans from the ECB’s €440 billion stability fund.
However, as a true cynic, I believe talk of an IMF bailout of Spain has been purposely leaked in order to encourage investors to participate in the upcoming auction. Hank Paulson’s analogy about having a bazooka in dealing with Fannie & Freddie serves as a useful illustration in understanding the tactics employed by the ECB in attempting to avoid a direct bailout of Spain. Here is Paulson’s quote:
To Senate Republicans worried they’re being asked to write a blank cheque for federal support to mortgage brontosauruses Fannie Mae and Freddie Mac, Treasury Secretary Henry Paulson offered an intriguing analogy on Tuesday: “If you’ve got a squirt gun in your pocket, you may have to take it out. If you’ve got a bazooka, and people know you’ve got it … you’re not likely to [have to] take it out.” In other words, give me an unlimited line of credit and I probably won’t have to draw on it. But give me X billion and force me to come back for more in three months after that hasn’t worked, and you’ll persuade people the U. S. government is powerless. Then where will we be?
Friday, June 4, 2010
More on the China Property Bust
As demonstrated in the chart below, April home prices in Beijing rose by a staggering 95% year-over-year vs. a nationally reported figure of 12.8% (though dividing total sales value of homes—384.6 billion yuan ($56.3 billion) in April—and the floorspace sold (72.4m square metres) yields growth of nearly 18%).

While there is little doubt that home prices are set to decline in China, low levels of personal and government debt should help lessen the damage from a property bust. As highlighted by the Economist (“China’s Economic Boom Can Survive a Property Bust”), the ratio of mortgage debt to GDP is only 15.3% in China, compared with a peak of 79% in America. The article highlights the example of Hong Kong’s late 1990s property bust to demonstrate that huge equity cushions should mitigate substantial damage to China’s banking system (unlike in the US and Europe). More specifically, in Hong Kong, where regulators bar mortgages of more than 70% of a home’s value, prices fell by almost half in the three years after the Asian financial crisis, yet mortgage delinquencies peaked at 1.4%. Finally, while mortgage books have grown by more than 70% for certain Chinese lenders, mortgages represent less than 20% of loans for most big banks, and loans to property developers account for perhaps another 8%. As such, banks have substantial capacity to absorb losses in the property sector, even if prices decline on the order of 25-30% (which is a distinct possibility given the massive run up we have seen).
While local government debt represents another distinct threat to the overall economy, particularly since they are heavily reliant on the property sales to fund their budgets, the article suggests these concerns may be somewhat overblown. According to Vincent Chan of Credit Suisse, land sales and property taxes should account for less than 17% of their revenues this year. Further, even if one uses an aggressive estimate of the debt carried by these local entities (11.4 trillion yuan as per calculations done by Victor Shih of Northwestern University), total public debt to GDP would be a manageable 50% of GDP, hardly alarming for an economy growing at over 10% in nominal terms and possessing $2.5 trillion of foreign currency reserves.
China's Property Market Slowing Down Sharply
Further evidence is emerging that China’s property market has begun to slow, as suggested in the chart below (see: China’s Property Market Freezes Up”). As discussed before, the Chinese government implemented several measures in April, including raising minimum downpayments on second homes to 50%, to help cool the market. On average, the number of residential property transactions in the four weeks after the curbs were unveiled is down 40% compared with the four weeks before the measures, according to figures covering 24 major cities from real-estate consultancy Soufun.com. The sharp slowdown comes as Beijing considers additional measures to push down prices, including imposing new taxes on residential property (though I suspect this will be reconsidered in light of the sharp slowdown already impacting the market).
Similar to the beginning stages of the US property bust, real estate agents and local investors are dismissing the slowdown as a short-term phenomenon. While they recognize that business has slowed, one gets the sense they view the dip as a buying opportunity. This quote from a Chinese real estate agent captures the complacency of the average Chinese person about the potentially serious consequences of a protracted property bust.
“What’s really dampened the market is the uncertainty. That overhang is what’s driving everyone to wait,” said Kevin Yung, executive vice president of IFM Investments Ltd., which runs the Century 21 real-estate agency franchise in China. “We think this could last another three to six months,” he said, a rough forecast shared by other industry executives. “We think prices are going to come down, probably by about 20%, but it will happen over time because this adjustment is driven more by policy than demand” he said.
Thursday, June 3, 2010
Warren Buffett Comment on Muncipal Bonds
Warren Buffett famously called derivatives “financial weapons of mass disruption” way before anyone realized the systemic danger they posed. Regarding municipal debt, I think the following statement spoken at yesterday’s Financial Crisis Inquiry Commission will prove equally as prophetic:
“If you are looking now at something that you could look back later on and say, ‘These ratings were crazy,’ that would be the area,” Mr. Buffett said about state and local government bonds. “If the federal government will step in to help them, they are triple-A. If the federal government won’t step in to help them, who knows what they are.”
“If you are looking now at something that you could look back later on and say, ‘These ratings were crazy,’ that would be the area,” Mr. Buffett said about state and local government bonds. “If the federal government will step in to help them, they are triple-A. If the federal government won’t step in to help them, who knows what they are.”
Tuesday, June 1, 2010
Strategic Defaults Threaten Housing Recovery
One of the biggest concerns weighing on the housing recovery remains the threat from “strategic defaults” by underwater homeowners (estimated at 25% of US households). With the backlog of foreclosures overwhelming the capacity of banks and mortgage servicers to deal with them, many homeowners are able to live rent free for months and potentially years on end. As suggested in the chart below, the average time it takes for a defaulting household to actually lose their property through a foreclosure has increased 75% since 2008 from 251 days in January 2008 to a staggering 438 days as of April 2010. The most egregious state is New York where the average homeowner spends 561 days in foreclosure, following closely by Florida at 518 days. Understaffing banks, government pressure to offer modifications, and incessant legal challenges have allowed millions of homeowners to live rent free, which in my opinion is creating an artificial boost to consumer spending, despite persistently high unemployment. With $2,000 or so freed up from not having to pay one’s mortgage, much of that money is being directed into other parts of the economy.

Some great quotes from a New York Times article (“Owners Stop Paying Mortgages, and Stop Fretting”) on the subject include the following (note how easy the profiled people are able to rationalize walking away from their contracts):
- More than 650,000 households had not paid in 18 months, LPS calculated earlier this year. With 19 percent of those homes, the lender had not even begun to take action to repossess the property — double the rate of a year earlier.
- One reason the house is worth so much less than the debt is because of the real estate crash. But the couple also refinanced at the height of the market, taking out cash to buy a truck they used as a contest prize for their hired animal trappers. It was a stupid move by their lender, according to [the homeowner] Mr. Pemberton. “They went outside their own guidelines on debt to income,” he said. “And when they did, they put themselves in jeopardy.”
- Foreclosure has allowed them to stabilize the family business. Go to Outback occasionally for a steak. Take their gas-guzzling airboat out for the weekend. Visit the Hard Rock Casino. “Instead of the house dragging us down, it’s become a life raft,” said Mr. Pemberton, who stopped paying the mortgage on their house here last summer. “It’s really been a blessing.”
- In Pinellas and Pasco counties, which include St. Petersburg and the suburbs to the north, there are 34,000 open foreclosure cases, said J. Thomas McGrady, chief judge of the Pinellas-Pasco Circuit. Ten years ago, the average was about 4,000. “The volume is killing us,” Judge McGrady said.
- About 10 new clients a week sign up, according to Mr. Stopa, who says he now has 350 clients in foreclosure, each of whom pays $1,500 a year for a maximum of six hours of attorney time. “I just do as much as needs to be done to force the bank to prove its case,” Mr. Stopa said.
Friday, May 28, 2010
Leveraged Loan Index Declines for First Time Since December 2008
The leveraged loan market is poised to post its first loss since December 2008, with the benchmark S&P/LSTZA Leveraged Loan index down 2.33% for the month. While modest relative to the equity markets, the index had posted 16 straight months of positive performance and has risen over 50% from its December 17, 2008 trough. Unlike the equity markets, the leveraged loan market generally shows a great deal of stability so a 2.3% decline represents a meaningful change.
As I have reported on several occasions, the loan market has gotten very pricey, with leveraged buyers driving incremental demand. Many hedge funds have employed total return swaps (“TRS”) to leverage their positions (essentially, borrowing a meaningful portion of the purchase price from investment banks). With LIBOR less than 50bps and current yields of only 3-4%, the only way to generate mid-teens returns (the hurdle for most credit funds), was to employ meaningful leverage in one’s book. An improving economy and significant liquidity in the credit markets enabled leveraged buyers to outperform the market. Many of those trades are breaking down and should continue to do so as credit spreads widen.
While we have gotten a bit of a reprieve over the last few days, liquidity in the market remains very low and suggests that a great deal of caution is warranted as investors look to bargain hunt. As is often the case, a slowdown in liquidity generally precedes true price discovery in the credit markets and I firmly believe that the worst is far from over. While we could get a bounce in credit over the next few weeks given May’s sharp selloff, rallies should be used as opportunities to lighten positions rather than increase exposure.
Another data point that should signal caution is the sizable outflows in high yield we have experienced over the last three weeks. Last week we saw a massive $1.4bn exit from the high yield markets, on top of a cumulative $2bn withdrawal over the prior two weeks. Cumulative year-to-date inflows are now only $534mm vs. the nearly $4bn we had seen before problems in Greece began making front page headlines.
Here is a good chart from BofA that shows the weekly flows into high yield since late last year. With the exception of two weeks of declines in Mid-February, we have experienced consistently strong inflows into the riskiest parts of credit.

Wednesday, May 26, 2010
China Reviews Eurozone Bond Holdings
As discussed in my post on May 11th (“Foreign Exchange Reserves by Currency”), a big trend over the last several years has been an increasing shift in foreign currency reserves from the US dollar into the euro. From 2004 to 2009, the euro’s share of foreign currency reserves has increased from 24.0% to 27.4%, while the US dollar’s share has declined from 66.9% to 62.1%.
Not coincidentally and as reported by the Financial Times today, China has begun to review its sizable holdings of eurozone debt, which the article suggests could be as high as $630bn (~25% of the country’s total reserves). While the US may benefit in the short-term as China reallocates some of its reserves to dollar-denominated assets, I continue to believe that gold will ultimately be the biggest beneficiary as the yellow metal represents a paltry ~1.5% of the country’s reserve assets (as opposed to the dollar and the euro which collectively account for 95% of the country’s reserves).
Here are a few key paragraphs from the FT article:
China, which boasts the world’s largest foreign exchange reserves, is reviewing its holdings of eurozone debt in the wake of the crisis that has swept through the region’s bond markets.
Representatives of China’s State Administration of Foreign Exchange, or Safe, which manages the reserves under the country’s central bank, has been meeting with foreign bankers in Beijing in recent days to discuss the issue.
Safe, which holds an estimated $630bn of eurozone bonds in its reserves [the country’s foreign exchange reserves totalled $2,447bn at the end of March, up $174bn in just six month]., has expressed concern about its exposure to the five so-called peripheral eurozone markets of Greece, Ireland, Italy, Portugal and Spain.
Any move by Safe would mark a significant change in direction, as Beijing has been trying to diversify away from the US dollar in recent years by buying a greater proportion of assets denominated in other currencies.
Tuesday, May 25, 2010
Another Spanish Bank Fails
As I reported on April 4th 2009 ("Spain Bails Out First Bank" - hard to believe over one year ago!), the bailout of Caja de Ahorros Castilla La Mancha (known as CCM) by Spain’s central bank, served as the canary in the coal mine that significant problems resided in the country’s banking system. This was particularly the case for the nation’s cajas (small, mutually owned banks controlled by depositors, employees, religious organizations and politicians), which had grown their market share from 10% to nearly 50% and continued to lend aggressively in 2006 and 2007, even as Spain's larger banks pulled back.
Over the weekend, we received another data point highlighting Spain’s troubled banking sector, when the central bank took over a Church-controlled savings bank, CajaSur. While the bank accounts for only .6% of the nation’s banking assets, future takeovers and forced mergers are imminent. In fact, yesterday four savings banks – Caja de Ahorros del Mediterraneo, CajaStur, Caja Extremadura, and Caja Cantabria – signaled their intent to eventually merge their operations. By consolidating, the banks are likely to receive financial support from Spain’s central bank, which will be necessary to sustain their operations.
Over the weekend, we received another data point highlighting Spain’s troubled banking sector, when the central bank took over a Church-controlled savings bank, CajaSur. While the bank accounts for only .6% of the nation’s banking assets, future takeovers and forced mergers are imminent. In fact, yesterday four savings banks – Caja de Ahorros del Mediterraneo, CajaStur, Caja Extremadura, and Caja Cantabria – signaled their intent to eventually merge their operations. By consolidating, the banks are likely to receive financial support from Spain’s central bank, which will be necessary to sustain their operations.
Thursday, May 20, 2010
Leading Indicator Surveys Flashing Red
Two leading indicator surveys suggest that the rebound in the US economy may be stalling (perhaps explaining the significant decline in the equity markets over the last few days). The ECRI Weekly Leading Index declined by 2% for the week ending May 7th, the lowest weekly decline since October 17, 2008. While this index has periodically declined from week to week over the past year, the 2% drop is significantly greater than any posting since the market bottomed last March (see 1st chart below).
In a similar vein, the Conference Board’s Monthly Leading Index survey experienced its first decline in April, falling a modest .1% (see second chart). While relatively small, the decline represents the first negative data point since March 2009 when the index fell .2%, only to be followed by a sharp rebound in April. Given that the market bottomed on March 9, 2009, most people view this survey as a remarkably prescient reading on were the market and economy are heading. While leading indicator surveys provide little insight into valuations and underlying fundamentals for individual companies, the fact that both surveys are flashing negative warning signs ought not to be dismissed by investors.

Wednesday, May 19, 2010
Shanghai Property Sales Hit Five Year Low
Homes sales in Shanghai fell to a 5 year low last week as measures put in place to curb real estate speculation in China appear to be gaining traction. According to Bloomberg, (“Shanghai Home Sales to 5 Year Low”) sales of new homes from May 10 to May 16 fell 16 percent to 60,000 square meters from the week before, the lowest level for the same period since 2005. Despite the sharp fall in volumes, average home prices in Shanghai rose 21 percent to 24,833 yuan per square meter during the month. Price increases in Shanghai are exceeding the national average, which rose 12.8% in April as reported last week by China’s National Bureau of Statistics (see chart below).

While difficult to draw too many conclusions from one week’s worth of data, the sharp falloff in Shanghai property sales has certainly spooked the market, with the country’s main stock index down 21% year-to-date, over 25% from its peak in August 2009, and nearly 10% in May alone. Chinese property developers and commodity sensitive equities have been getting crushed as well.

Friday, May 14, 2010
An ATM That Dispense Gold
While I have been advocating gold for some time and continue to believe it represents an appropriate hedge in one’s portfolio, pictures like the one below suggest we could be setting the stage for a massive bubble. As frightened Europeans turn their rapidly depreciating euros into hard assets, we will likely see continued upward pressure on the price of gold.
Though it feels good to be riding the wave, at some point central banks will be forced to stop speculative runs on their currency. Though I believe we are months and perhaps years away from such a situation playing out, investors chasing the rally in the yellow metal ought to pay close attention to the commentary emanating from the world’s major central banks. With pledges to keep interest rates at zero, endless guarantees afforded to private sector banks, and incessant money printing, central banks are clearly communicating a message that forestalling a deflationary debt unwind remains priority number one. As such, investors are acting perfectly rationally by selling currencies and buying gold.
However, I am under no illusion that buying gold is a one way bet. Personally, I think we breach the previous inflation adjusted gold price of $2200/ton before central banks feel compelled to defend their currencies (particularly the United States). Again, that day may be some ways off, but at some point inflationary forces building in the economy will force the hands of the supposed protectors of fiat currency.

Tuesday, May 11, 2010
Foreign Exchange Reserves by Currency
Here is a great chart from the IMF that shows a breakout of foreign exchange reserves by currency. The key takeaway from the data is that the euro has increasingly grown its share of foreign exchange reserves over the last five years. As of Q4 2009, the euro accounted for 27.4% of foreign currency reserves vs. 24.0% in 2005. Conversely, the dollar’s share of foreign currency reserves has shrunk from 66.9% in 2005 to 62.1% as of Q4 2009. Collectively, the two currencies account for 89.4% of total foreign reserves, with the pound (4.3% of total), yen (3%), and other miscellaneous currencies accounting for the remainder.

Given recent events in the euro zone, I would imagine we see a reallocation away from the euro into the dollar, yen, and hard currencies. Perhaps the biggest beneficiary will be gold, which as I write this post is making new all time highs.

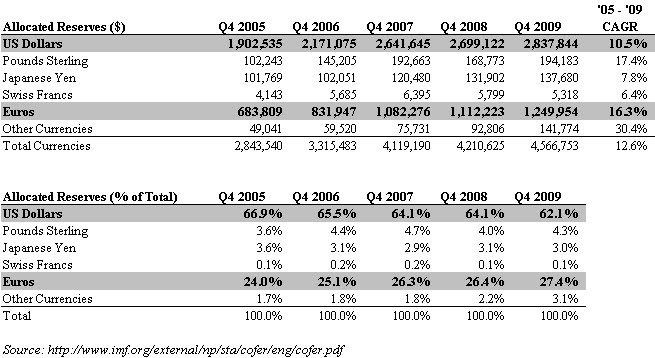
Given recent events in the euro zone, I would imagine we see a reallocation away from the euro into the dollar, yen, and hard currencies. Perhaps the biggest beneficiary will be gold, which as I write this post is making new all time highs.
As I have suggested in prior posts, most Asian nations (China, Japan, India, Taiwan) remain grossly underinvested in gold relative to their Western brethren. China is the most glaring example of this with less than 2% of its foreign exchange assets in the yellow metal. Conversely, the US, Germany, France & Italy all maintain gold in excess of 65% of their total reserves. While China is unlikely to get to this level anytime soon, even a relatively modest move to 10% would require the purchase of 4,500 additional tons or nearly two years of total global production (note: annual production of gold is approximately 2,500 metric tons). The implications of this strategic move on the price of gold would be massive.

Monday, May 10, 2010
Greek Bonds Yield Snap Back After EU Bailout Package
As I highlighted on April 23rd, the recent blowout in Greek’s government bond yields presented a good trading opportunity for those investors willing to bet that the EU and IMF would not let their troubled neighbor default on its near-term debt. While the long-term implications from today’s €750 billion bailout remain extremely troubling, the fact of the matter is that France & Germany have been consistently resolute in their commitment to stand by the PIIGS. In engineering one of the biggest short squeezes in modern day history, Europe has sent a clear signal to those pesky hedge funds that they better not consider “attacking” the euro again. Anybody who thought they were bluffing is not feeling so good today.
As indicated in the chart below, Greek two year bond yields have snapped back from 17.3% on Friday to 7.1% this morning. The increase in price from 79.60 of par on Friday to 95.10 today suggests an overnight gain of 20%. Anybody courageous enough to go long Greek bonds last week would be wise to close out their position given the uncertain environment that lies ahead. While the EU’s commitment significantly diminishes the near-term probability of a default, last week’s footage of riots and anarchy suggests the difficultly Greece will have in implementing the austerity measures needed to secure continued EU and IMF funding.
The most important takeaway from the last two years is that governments remain unwilling to let insolvent institutions fail. Whether it is underwater homeowners, overlevered US banks, or profligate European countries, governments have proven time and again that avoiding the consequences of failure usurps the importance of containing moral hazard. It is unfortunate that an investing thesis predicated on “shaking hands with the government” has proven the winning strategy over the last few years. However, the important point is that this can’t go on indefinitely. Governments simply can’t go on assuming the risk of too big to fail banks or countries before investors begin to lose faith in the currencies that underpin these economies (hence my long-term bullish view on gold).
Thee only difference between Greece and California is about 2 years. Just as irresponsible European countries have been able to borrow at artificially low rates thanks to their association with the EU, so too has California been able to borrow in the municipal bond market at rates that severely understate its standalone risks. However, as Greece has shown us last week, there is no rule against sovereign states or nations going bankrupt.
Implicitly, investors must be assuming that the US government would never let its largest state default. However, as the world’s eighth largest economy, California is simply too big for the US to assume its obligations without the dollar/US treasuries coming under severe strain. Investors ought to keep this in the back of their mind as they celebrate the sharp rebound in today’s markets.

Subscribe to:
Posts (Atom)

